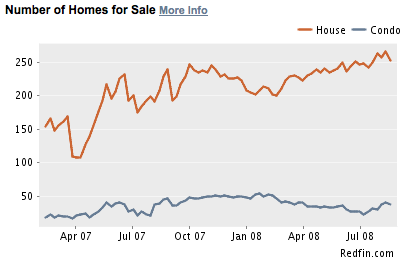
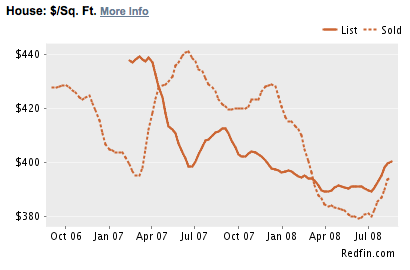
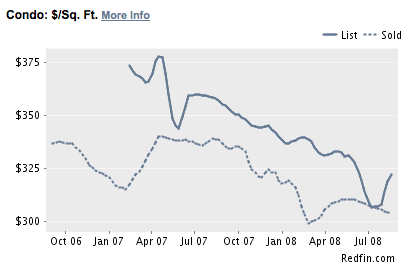
Redfin has an excellent feature called “Inventory and Housing Trends.” The data is city-specific and gives us a good idea of where home prices are heading. The data below is specifically for Arcadia, California and basically supports what we’ve been stating all along. Arcadia home prices are under heavy pressure from increasing inventory, rising foreclosures and low-affordability.
Inventory has essentially more than doubled since April of 2007. This is what happens when people are forced to sell their homes due to exploding ARMs, weak job market and just simply being underwater on their mortgage.
I suspect that we will break through the $350/sf mark for single family homes by the end of 2008.
All those PUDs, condos and condo conversions will be hurting next year once the median is comfortably below $300/sf.
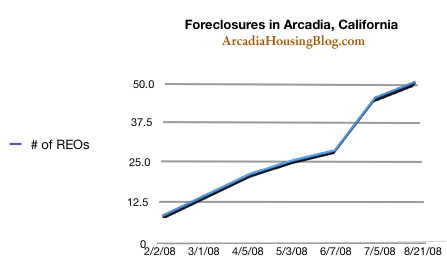
If these charts weren’t dismal enough, here’s my chart tracking the increasing number of Arcadia foreclosures over the last 6 months.
These are basically the first Arcadia-specific charts I’ve posted since arcadiahousingblog.com was launched. We have dozens of charts and graphs for Los Angeles county but historical city-specific data is always difficult to come by. Now that we have them, I hope all you readers will find the information useful!


I like this feature from redfin. I was wonder what is your opinion of the upward tread of the past few months. Is it because of people looking to buy at a good school district?
From the upward trend in prices, it is obvious we have hit bottom and prices and going up up up! You had better buy now or be priced out of market forever.
So what over-priced house are you trying to sell to make this comment?
The upward trend is the typical Summer sell-off as families relocate, young professionals move in/out and sellers test the market.
If you take a look at July 2007’s figures, there’s always a big bounce. After that, the market will continue on its current trend as both buyers and sellers take themselves off the market.
Is this what people refer to as a “dead cat bounce.”
Can you post a chart compare Arcaida’s REO’s and other city or LA County?
Thanks!
We have not hit bottom, yet. We should see price drop for another year.
It’s only obvious to realtors with wishful thinking. I think the NASDAQ did this quite a few times while it tumbled back to reality. Some eager beavers like to jump the gun because they see a 25% off sign on something marked up 100%. We call them knife catchers. So that must be a knife catcher bounce.
I wish posters would stop comparing the stock market with the housing market. No correlation.
You can interpret into the statistics all you want but at the end of the day it comes down to affordability.
I hear many predictions but there will be no return to boom times as long as creative financing is not there. The ARMs with teaser rates fueled the boom so look back at pricing preARMs and that’s where the bottom will be…circa 2004.
To think prices will bouce back 15-20% by this time next year is the height of being naive.
This from the current issue of Forbes:
“”Nationally, one-third of homes are underwater, and 20% of transactions happening across the country are foreclosures,” says Stan Humphries, vice president of data and analytics at Zillow.com, an online aggregator of real estate listings and public sales records. “That’s what drives up the number of home sales for a loss.”
As long as conditions like this exit there will be no recovery. In other words, we need to see prices STOP falling for a few quarters before they can go up.
I’ll be happy to make the comparison. Just give me some time to collect the data.