If you refer back to last week’s Inventory post, I had listed the number of home sales for 1st quarter of 2008:
| Date | Sold | Median Price | Change YOY |
| January | 32 | $687,500 | 4.17% |
| February | 32 | $815,000 | -20.61% |
| March | 35 | $725,500 | -13.16% |
That’s a total of 99 homes sold in Arcadia over the last 3 months. How does this compare to previous quarters when the bubble was in full swing? On the chart below, we’re currently on the very right at just under 100 sales.
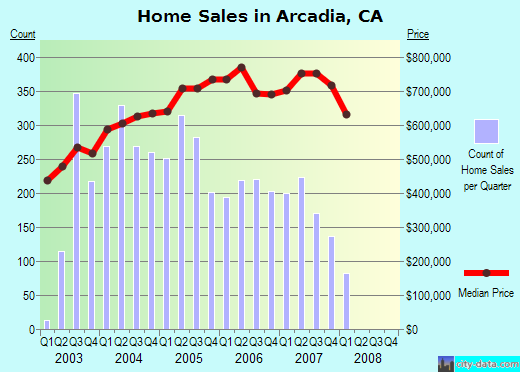
Sales skyrocketted during the last half of 2003 and for 4 years Arcadia quarterly sales remained around 200 transactions or more per quarter. That’s averaging about 66 homes a month. We’re currently reporting half those numbers for 2008.
If you look at the Median Price line (in red), it tends to follow the general trend of sales activity. Back in March, our friend over at Dr. Housing Bubble had posted a similar looking chart but it was tracking the median price for LA County.
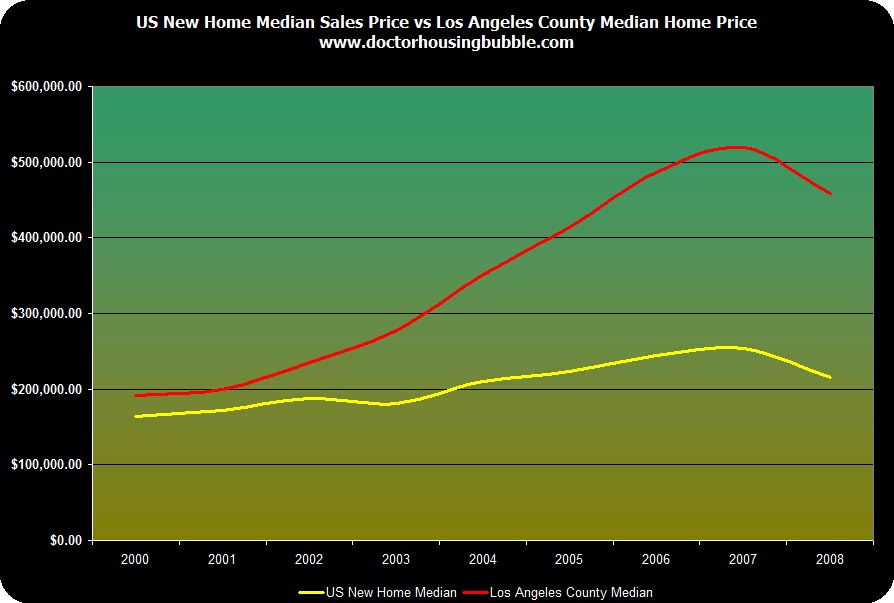
Unless income increases significantly, it looks like Arcadia will continue to follow the general trend of the rest of the county, state and country. And although real estate here will always command a certain premium in terms of pricing, I see 1,000sf, 67 year-old homes listing for $775,000 and my only question is, “WTF?”
This property was bought on January 4th, 2008 for $600,000. I cannot imagine how this home could have commanded a $175,000 premium in just under 4 months.
From the listing:
MUST SEE TO APPRECIATE, MOTIVATED SELLER WILL LISTEN TO ANY REASONABLE OFFER. HURRY HURRY HURRY!!!!!
Hey, look on the bright side. At least it comes with a professionally installed greenhouse.

SBG,
I believe you got the median price incorrectly for the recent quarter. If all 3 months median price is above 680K, how can your quarterly median price be below 650K?
llking,
Sorry, I forgot to point out why the discrepancy in those two numbers. My data showing the median price for each month was pulled from DataQuick. (dqnews.com)
The graph underneath was pulled from City-Data and I believe they use figures pulled from U.S. Census. (city-data.com)
Thanks for bringing this up. I’ll take a look into why the numbers don’t match up.