Yesterday, we wrote about how foreclosures will lead this housing correction and the reported numbers are breaking all sorts of records:
California – 1st quarter 2008
- 113,676 Notice of Defaults issued – Up 39.4% from the previous quarter.
- Notice of Defaults are up 143.1% from first quarter 2007.
- Actual foreclosures totaled 47,171 – Highest since DataQuick started tracking in 1988 (20 years ago).
According to DataQuick, the increase in foreclosures can be contributed to a significant drop in property values and the wave of exotic mortgage made in 2005-2006. Remember the Map of Misery? It gives you an idea of where the largest numbers of exotic mortgages are concentrated in.
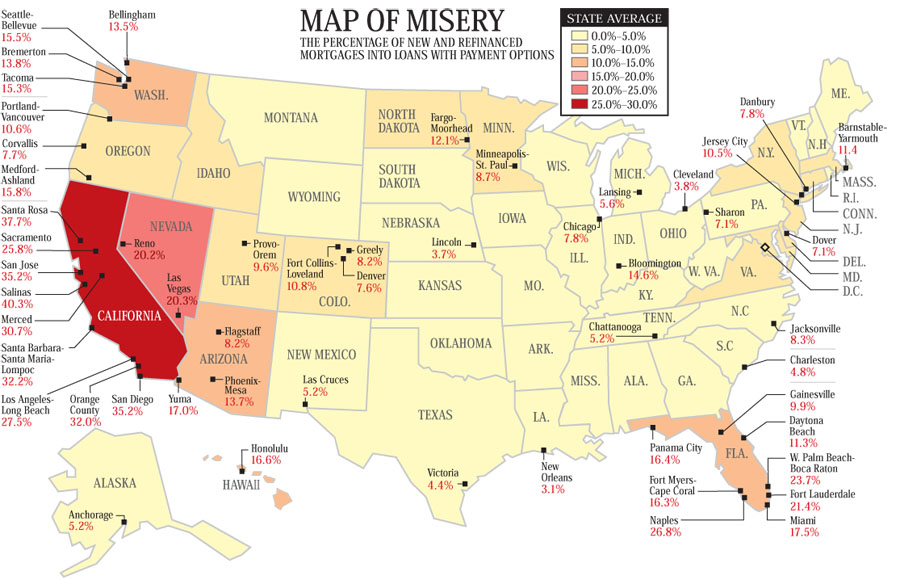
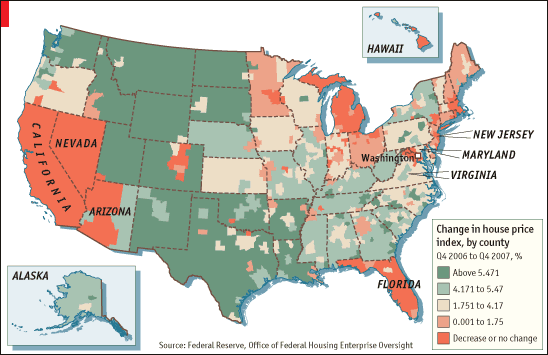
These red states experienced incredible price appreciation leading up to the peak of the housing bubble. As reflected on the map below, they are now experiencing the brunt of decline.
Although we sounded crazy predicting a long and hard housing crisis, it looks like Wall Street is starting to reach the same conclusion that many housing blogs came to last year. According to a Goldman Sachs analyst, “the correction in national house prices is only halfway through” and,
Arizona, Florida, Virginia, Maryland, California and New Jersey, could see further price declines of 25% or more.
God I hope so, then i could actually buy a house withough working two jobs.
My SO and I are working professionals and still find it next to impossible to comfortably afford a mortgage. This is after accounting for a 20% down payment on a modest SFR.
Fortunately, prices have come down in Arcadia and another 25-30% drop does not seem unreasonable since homes doubled and nearly tripled in value during the peak of the bubble.