Most bubble blog readers know that the housing correction will be severe, but I sense that the average Joe still does not quite understand the magnitude of the consequences caused by this Great Ponzi Scheme. The mainstream media is partially to blame for their cheer-leading headlines and quotations from the National Association of Realtors’ (NAR) misleading reports, but it is the homedebtors’ natural reactions of denial and hope that brings mixed feelings to the market.
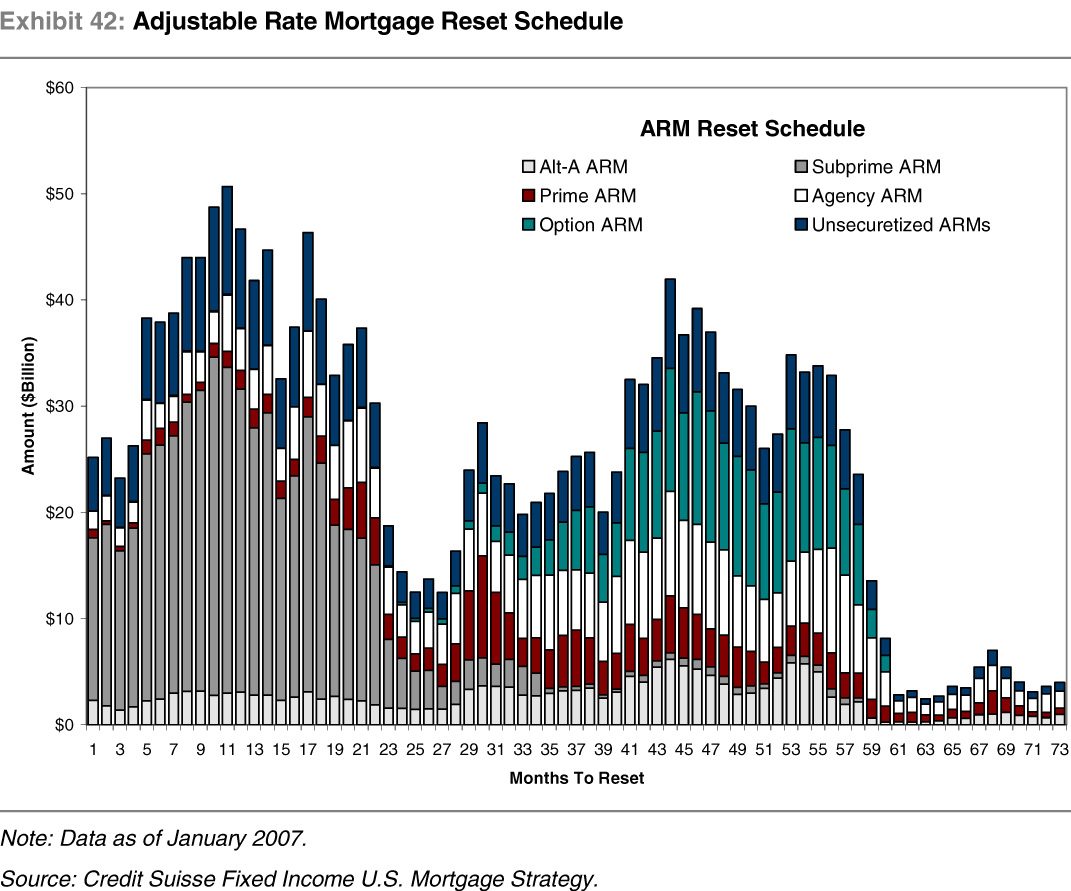
I spoke to a homeowner last week about the housing crisis and she told me that she’s not worried because once we get all the subprime lending out of the system, everything will revert back to normal and “be okay.” My breakfast almost ended up all over my keyboard and monitor. I cannot say this enough – the problem is much bigger than just subprime loans. Tomorrow, we will be at #16 of this now infamous Credit Suisse chart. As you can see, we still have a long way to go.
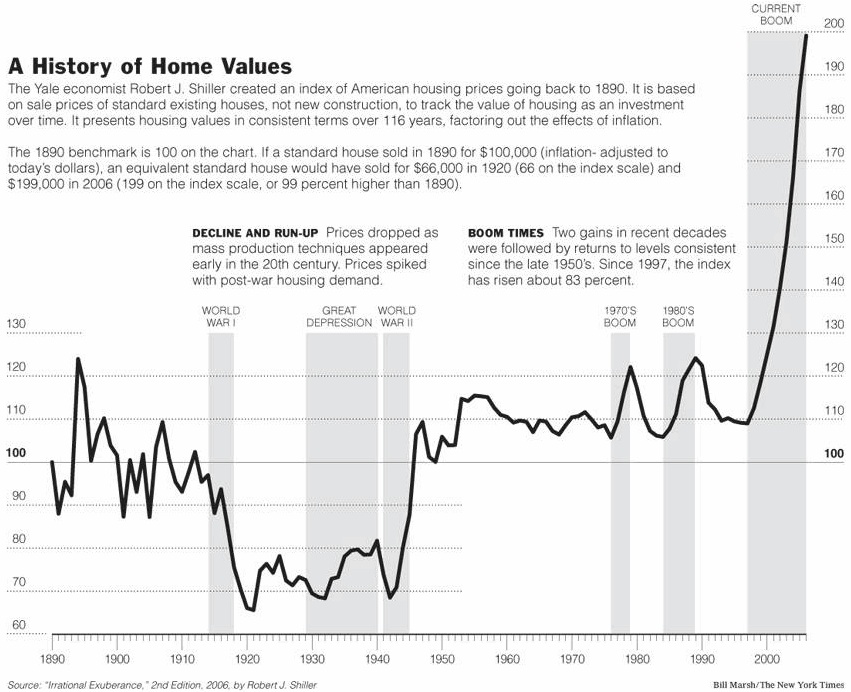
This isn’t the first housing bubble we’ve come across and I hear many people comparing this bubble with that from the 80s and 70s boom. While history doesn’t always dictate the future, it gives us a good basis of comparison. There’s no exaggeration when I say that we’re making our way through a bubble of epic proportions. It’s not a joke; this is history in the making.
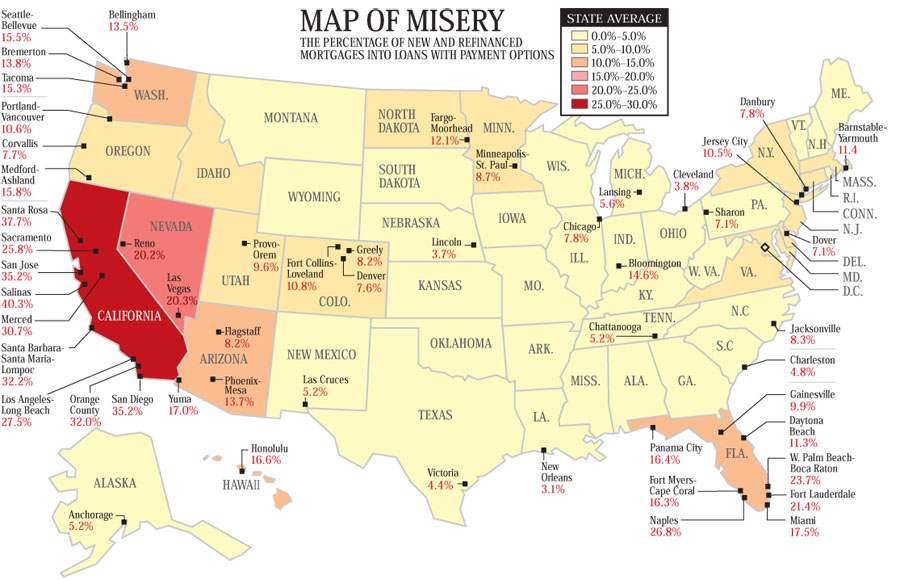
Remember how the NAR always says that “every market is different” in those malicious tv commercials? Well, there is actually some truth to that. Some markets, like California, Nevada, Arizona and Florida are in fact different – they’re especially bad when it comes to the percentage of new and refinanced mortgages with option payments. It’s no wonder these states enjoyed the biggest run-up and will soon experience the biggest correction, as compared to other parts of the country.
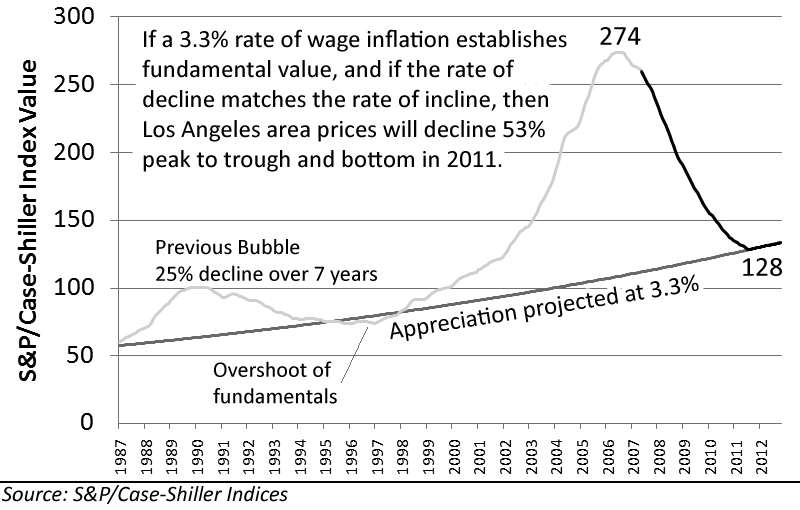
California is in it for a rough one and Los Angeles is no exception. During the boom, we saw homes that doubled in price over just a few years with the bidding frenzy feeding off the people’s greed and ignorance. Now that the fountain of kool-aid has stopped flowing, many are left to wonder how the correction will play out. This is a projection based on the Case-Shiller Indices and according to this chart, the end of the correction is sometime in 2011 or 2012. We are currently at about 225 on the index.
Yesterday, TheArcadian reported the numbers at the national, state and city level. Nothing in the data suggests that we’re “turning around” or “at the bottom.” During the boom, many laughed and scoffed at me like I was a mad woman when I entertained the possibility of home prices crashing 35-50% from the peak. All the bulls and wishful homedebtors should put away their hopes of a rebounding 2008. February’s report shows that Arcadia’s sales volume is down 28% and its median home price down 20.6%, both year-over-year.
We’re not even halfway through the correction yet and all of a sudden, 35% off the peak doesn’t sound so crazy after all.
i couldn’t agree with you more. i know exactly what you are talking about when trying to “convince” people that prices will go down. a lot of people argue that prices will never come down, while others believe it can only dip 10% at most. we’ve definitely seen that both of these statements have not held true. i guess we are going to have to wait until it happens and then say “i told you so.”
btw, ive been following this data on many other blogs and articles and now im just waiting for everything to happen. i wish i could just fast forward to 2011 already.
I don’t bother trying to convince anyone anymore because they won’t listen. Showing data doesn’t do anything since it’s all blocked out by their denial. If asked for my opinion, I will give it, but I don’t bring up the housing crash issues voluntarily.
Sometimes I wish we could fast forward to 2011 too, but since we can’t do anything about that – I just sit and watch my savings grow month after month. The longer it takes to reach bottom, the bigger my downpayment. 🙂
im getting so tired of waiting. ive been saving up a good amount of money since ’03 (when i first got a real job). i thought that the end of the housing bubble would be just a year or two away. its been 5 and i know its going to take another at least another 2-3 yrs. im just frustrated since im tired of apartment life. i want a garage and a driveway to store my toys and park my cars. i want to blow money on stupid things like TVs and furniture to make the place my own.
626chump,
You took the words straight out of my mouth. I am also so sick and tired of waiting.
If it weren’t for this bubble, I would have already been 1 to 2 years into my mortgage. We don’t make a lot, but enough to have bought a decent SFR at pre-bubble prices.
chump, you are not alone! I have about a dozen friends who are in the same boat and we intend to watch this housing crisis play out. Just say NO to the mortgage bailout and we will be on our way to a well deserved correction of prices.
I wish my neighbors only laughed. When I lived in Upland, my neighbors — all of whom had refinanced several hundred thousand dollars out of their homes — were downright hostile about the fact I wouldn’t pull money out to “upgrade” my tract house. I sold out near the top and left town.
Guess who’s laughing now…congrats on getting top dollar for your tract home.
This is one terrific post! I think I’ll permalink to it on Stop The Housing Bailout. It illustrates that the housing “crisis” is driven by unaffordability (if that is in fact a real word).
Thanks for the post.
The arcadia housing blog author predicted a 35% to 50% drop in values from the peak. The author also predicted that we are only half way there and have another 3 years to drop.
My analysis of current actual value in most Sacramento area markets is that our zip codes have already had an average 27% decline from the peak, with some zip codes a full 50% decline from the peak.
So the doomsayers were right in their percentages, but why do they not notice that except for a few overpriced listings, most escrows closing this spring are realizing the discounts that they predict to be two to 3 years in the future?
I don’t follow Sacramento real estate as closely as I follow that of the Arcadia or other SGV cities. My estimate of 35-50% declines over the next few years is for Arcadia – not Sacramento. Prices went up at different times for different cities so it’s no surprise that prices crash at different times either.
A suggestion guys…stop living in apartments! Do what I used to do, go rent a condo or a house. You can find them in the paper and most real estate agents will help you find one too. You could also call property management places directly as well. Then you can get something that is more like a house, or in fact is a house until prices get reasonable.
Also, for those of you building up cash to buy – why not put down less and buy multiple properties when we finally bottom out? Take advantage of the crash and eventual recovery as everyone foolishly forgets what happened (again.)
Like you, I’m just trying to get the word out to uninformed buyers, sellers, renters and just about everybody. Thank you for your work at Stop the Housing Bailout – I think it’s a smashing idea!
As a former Los Angelean, now a Seattle resident, real estate agent and real estate business advisor to http://www.Allbusiness.com, I hear the message. I returned to L.A. as a young adult in the early eighties. My peers and I were all priced out of the market then. The talk was no different, though perhaps related more to exhorbitant loan interest rates, as well as housing prices at the time. The California market has been and remains statistically more volatile than others. Still, over time, its gains tend to be bigger. In my opinion, any buyer’s strategy in such a market should be for the long term, seven years or more.
If homeownership and the investment opportunity it represents is a must-have, consider making an investment property purchase in other, more stable markets where equity gains are better protected. Perhaps then that eguity can be leveraged to purchase in the local market as it stabilizes.
Tyler you are totally right. Markets like Charlotte and San Antonio are a lot more stable and less susceptible to these huge swings in price. I’ve been looking into buying some investment properties in Charlotte of late and its very encouraging. I would actually be able to charge enough rent to break even! What a concept! (fyi i live in socal and its been 10 years since that was a possibility – the people who bought properties to rent out here in the past 10 years are just plain suckers. There is no way in hell their rents are covering their outlay unless they put a TON down which is unlikely…)
Please forgive my ignorance, but how exactly do taxpayers end up paying for the proposed bailout?
bg,
That’s a valid question. I’ve written a short comment about it for this Saturday’s post. Please let us know what you think.
I am completely against any government bailout. The thought that my hard earned dollars would go to helping out an irresponsible person who bought a home he/she could not afford to pay for makes me sick. This is a slap in the face of people who did not make reckless decisions with their money.
I CHOSE not to take part in the hyper inflation in home prices we have seen since 2000. I have been patiently waiting and saving money for runaway home prices to correct themselves. The prices finally are adjusting since reaching an artifitially high level and are moving down towards their natural equilibrium.
The housing mess will not unwind itself in 2008. In the next year, prices will have fallen another 10 – 15% in most areas.
Contact ALL congresspeople who are in favor of a bailout and let them hear your displeasure:
Barney Franks – 202-225-5931
Chris Dodd – 202-224-2823
Diane Feinstein – 202-224-3841
Barbara Boxer – 202-224-3553
Also, contact the Fed. It was THEIR 1% BS that got is into this bubble to start with. They should not be exempt from hearing your displeasure. They are now needlessly lowering interest rates simply to pacify the IRRESPONSIBLE people who took out ARM loans and want to refinance. This at the expense of responsible savers.
The Fed – 202-974-7008
Agreed. I’ve contacted my representatives and I urge everyone else to do the same.
Thanks Sean for listing out their phone number so the readers here can spam their voice mailbox with STOP THE BAILOUT messages. *starts dialing*
Work and save, yes, but also get involved in politics! Inflation could wipe out your savings, and inflation will be resorted to if there is no opposition.
The Feds will take interest rates down to 0 if they have to so inflation is already at our heels. I have written to my representatives and urge everyone else to do the same.
I just discovered the blog. Love the post. We’ve been happily renting for the last 5 years. At the height of the market I knew the end was near, but I guess like all bubbles a lot of people were blinded by greed and the National Association of Realtards’ talking heads on CNBC telling everyone that 2007 was going to be a great year. You’d think the media would stop looking to NAR for comment, but they never do.
“We should see a bottom in 2008 and then the sky’s the limit. Hooray! The party’s not over! By the way, what is the Case-Shiller index” -NAR
realtards.blogspot.com
AvRqot
When I read this post originally, I was convinced that someone finally had comiled a concise summary of what happened, and where we are headed, in thie housing correction. Bravo!
It would be great to revisit this again, 3 months later, and do an update/follow-up. I would love to see how closely the numbers are tracking.
Tyler you are totally right. Markets like Charlotte and San Antonio are a lot more stable and less susceptible to these huge swings in price. I’ve been looking into buying some investment properties in Charlotte of late and its very encouraging. I would actually be able to charge enough rent to break even! What a concept! (fyi i live in socal and its been 10 years since that was a possibility – the people who bought properties to rent out here in the past 10 years are just plain suckers. There is no way in hell their rents are covering their outlay unless they put a TON down which is unlikely…)(3)
What was it about ARM resets that captivated people’s minds back in 2008, when this piece was originally written? Pretty much every analysis on the matter you can still find, to this day, has been written around 2007 – 2008 and includes dire predictions for the years 2010-2012. Well, we are living it now and I think too much unsold inventory is still depressing the market more than the way the debt is structured ever could.