If you refer back to last week’s Inventory post, I had listed the number of home sales for 1st quarter of 2008:
| Date | Sold | Median Price | Change YOY |
| January | 32 | $687,500 | 4.17% |
| February | 32 | $815,000 | -20.61% |
| March | 35 | $725,500 | -13.16% |
That’s a total of 99 homes sold in Arcadia over the last 3 months. How does this compare to previous quarters when the bubble was in full swing? On the chart below, we’re currently on the very right at just under 100 sales.
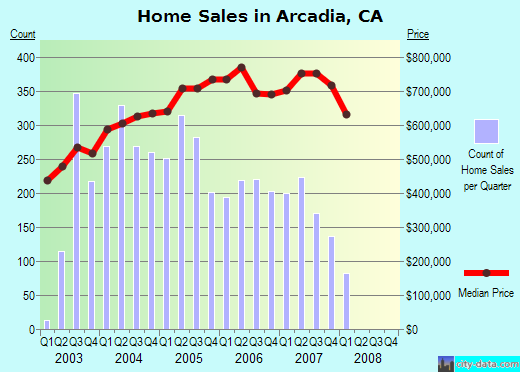
Sales skyrocketted during the last half of 2003 and for 4 years Arcadia quarterly sales remained around 200 transactions or more per quarter. That’s averaging about 66 homes a month. We’re currently reporting half those numbers for 2008.
If you look at the Median Price line (in red), it tends to follow the general trend of sales activity. Back in March, our friend over at Dr. Housing Bubble had posted a similar looking chart but it was tracking the median price for LA County.
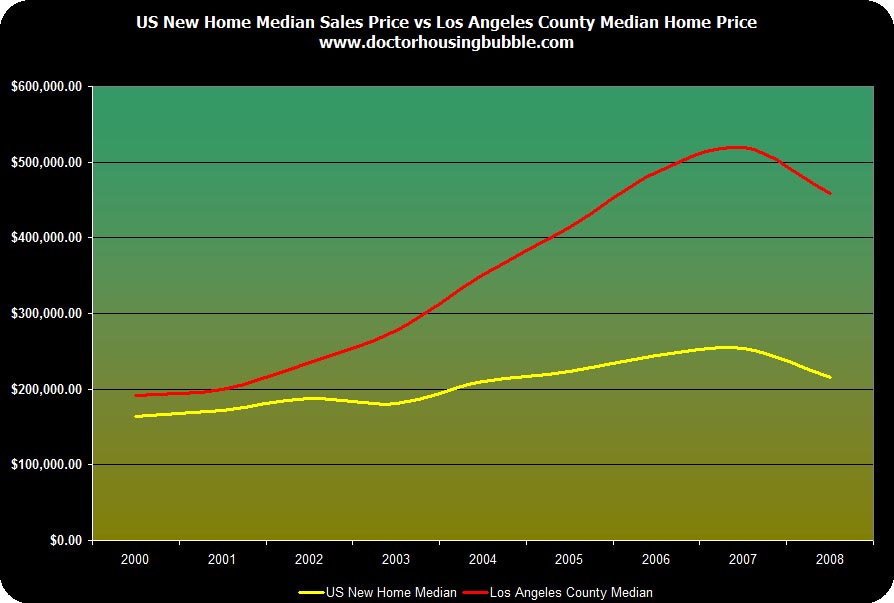
Unless income increases significantly, it looks like Arcadia will continue to follow the general trend of the rest of the county, state and country. And although real estate here will always command a certain premium in terms of pricing, I see 1,000sf, 67 year-old homes listing for $775,000 and my only question is, “WTF?”
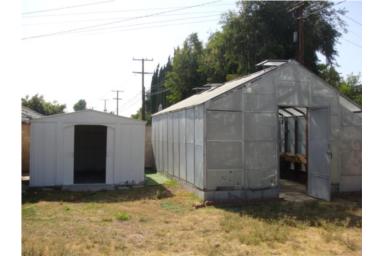
This property was bought on January 4th, 2008 for $600,000. I cannot imagine how this home could have commanded a $175,000 premium in just under 4 months.
From the listing:
MUST SEE TO APPRECIATE, MOTIVATED SELLER WILL LISTEN TO ANY REASONABLE OFFER. HURRY HURRY HURRY!!!!!
Hey, look on the bright side. At least it comes with a professionally installed greenhouse.
SBG,
I believe you got the median price incorrectly for the recent quarter. If all 3 months median price is above 680K, how can your quarterly median price be below 650K?
There must be an ocean view from this property to be asking this cool $775k. Perhaps, there is gold mine or oil reserve underneath the property. Perhaps, the owner and the realtor are just having too much to drink.
llking,
Sorry, I forgot to point out why the discrepancy in those two numbers. My data showing the median price for each month was pulled from DataQuick. (dqnews.com)
The graph underneath was pulled from City-Data and I believe they use figures pulled from U.S. Census. (city-data.com)
Thanks for bringing this up. I’ll take a look into why the numbers don’t match up.
The sample size seems too small to determine accurate Median price. I think it would useful to see the the price per square foot, grouped into how many years old the home is when sold or when it was remodeled.
Personally I think looking at data compared to the previous year is dangerous. For example, when the Nasdaq was 4000 after hitting 5000 it was 20% off the high, but over 7 years later, it’s still around 2500.
It’s true that stocks and homes are not the same. But most people graph stocks and not home prices. So it’s good to see home technical data. I really enjoy the home price vs income. It shows how far off current values are.
My thoughts exactly. With only 30-some sales each month, it isn’t a very good indicator of where prices are actually heading. But by comparing quarter-to-quarter sales volume, we get a good idea that buying activity has slowed down dramatically and inventory will no doubt continue to increase; therefore putting more pressure on home prices.
Like you, I am absolutely baffled by this listing. Do any readers here see something that I’m missing?
What if that’s not the greenhouse —
THAT’S THE PROPERTY?