| Asking Price | $999,000 | ::: | Sq-ft | 2400 |
| Purchased Price | $850,000 | ::: | Lot Size | 14,500 |
| Purchased Date | 12/04/2007 | ::: | Beds | 4 |
| Days on Redfin | 10 | ::: | Baths | 3 |
| $/Sq-ft | $416 | ::: | Year Built | 1957 |
| 20% Downpayment | $199,800 | ::: | Area | Highlands |
| Income Required | $249,750/yr | ::: | Type | SFR |
| Est. Payment* | $5,051/month | ::: | MLS# | 12105594 |
*Estimated monthly payment assume 20% down, 30-yr fixed @ 6.50%
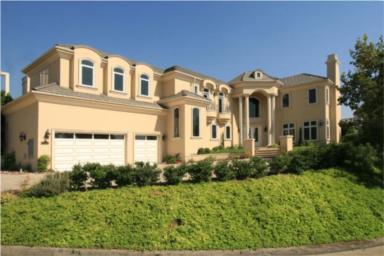
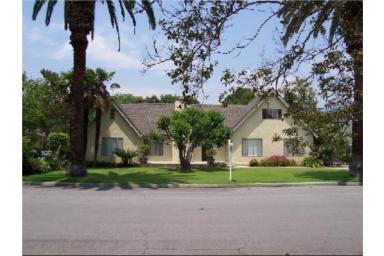
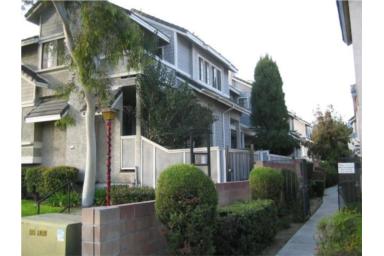
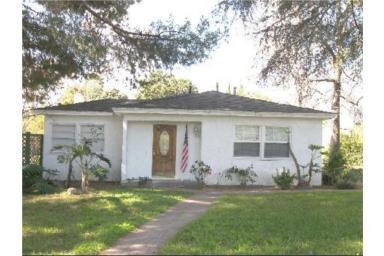
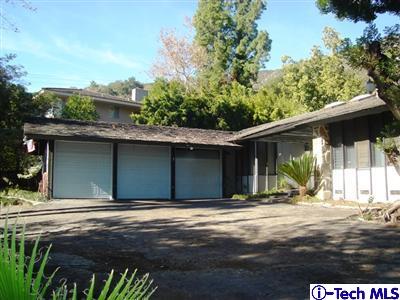
“THIS IS THE FIXER YOU’VE BEEN WAITING FOR * SHOW AND SELL!!!”
This flipper bought this dump 10 weeks ago and turns around to sell it for $149,000 profit after doing absolutely nothing to improve the property. It’s even worse than the flippers who list at wishing prices just because they put in some granite counters because this guy didn’t even bother to do that. They obviously don’t bother hiding that fact because it says right in the description that this is a fixer. Everything looks very dated in the pictures as well.
The strategy here was buy, wait about 2 months and re-list it for a profit. Um, okay. This might have worked back in 2005 when lenders gave away free money, but that’s long gone. Either he’s been living under a rock for the past year or just completely overtaken by greed. Something tells me it’s the latter.

I don’t understand the train of thought. Why would this flipper think that someone will actually purchase this property for $149,000 more than what he paid 2 months ago? There’s wishful thinking and then there’s just absurd thinking. It doesn’t make sense in any market, but it’s especially concerning in today’s drowning market. It shows that the kool-aid was flowing so fast and so abundantly during the boom that flippers and realtors are still overdosing on it in Feburary of 2008! How long will it before there’s no denying the facts?
Flipper – Shame on you for being so greedy.
Realtor – Shame on you for not acting in your client’s best interest.
Lender(s) – Shame on you for letting things get this bad.
Shame on all of you.