All posts by TheArcadian

Inventory & Market Report – 5/10/08

Zip Codes: 91006, 91007market_icon.jpg

Current Market Listings as of May 10th, 2008*
Properties for Sale: 218 (+0)
Median Listing Price: $779,000 (-0.38%)

Weekly Foreclosure Update*
Properties in Foreclosure: 23 (-1)
Properties in Pre-Foreclosure: 65 (-1)
*+/- is compared to previous week’s data.

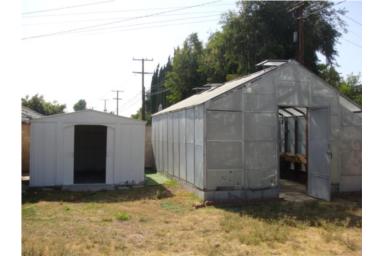
495 days and counting. That’s how long the property below has been listed on the market. It’s a newly built detached townhome and from the way it looks, this home has been standing vacant for over a year (when it was first listed).

519 S. 5th Ave. #C
Arcadia, CA 91006

5195th1.jpg

5195th2.jpg

5195th3.jpg

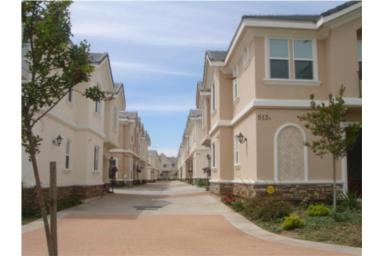
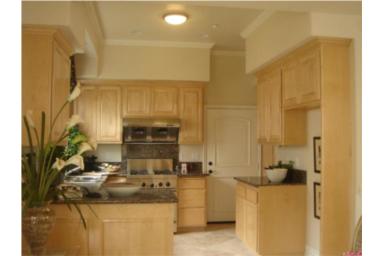
Listing Price: $768,000
Beds: 3
Baths: 2.5
Sq. Ft.: 2,002
$/Sq. Ft.: $384

This property’s listing price history is equally as impressive as its time on the market.

Date Price
Jan 26, 2007 $779,000
Feb 02, 2007 $789,000
Feb 24, 2007 $809,000
Apr 11, 2007 $808,900
Apr 29, 2007 $819,000
Jul 11, 2007 $818,000
Sep 04, 2007 $798,000
Oct 12, 2007 $758,000
Oct 16, 2007 $718,000
Nov 01, 2007 $728,000
Nov 02, 2007 $739,000
Nov 09, 2007 $738,000
Dec 19, 2007 $769,990
Dec 19, 2007 $769,000
Jan 11, 2008 $729,000
May 03, 2008 $768,000

There are 13 units in this cluster of townhomes. From what I can see, the investor/developer who built these can’t afford to sell them for under $700,000. We profiled unit #B back in April that one eventually sold for $735,000 after sitting for 400+ days on the market.

How many more months of interest will these investor(s) pay on their unsold homes? What was initially a profitable investment is turning out to be a big headache as these units continue to lose their value each week that goes by.

Property and foreclosure numbers obtained from U.S. Census, ZipRealty, Trulia, Yahoo Real Estate and Foreclosure.com. Market listings and price data obtained from DataQuick News.

Foreclosures leading the way

Yesterday, we wrote about how foreclosures will lead this housing correction and the reported numbers are breaking all sorts of records:

California – 1st quarter 2008

  • 113,676 Notice of Defaults issued – Up 39.4% from the previous quarter.
  • Notice of Defaults are up 143.1% from first quarter 2007.
  • Actual foreclosures totaled 47,171 – Highest since DataQuick started tracking in 1988 (20 years ago).

According to DataQuick, the increase in foreclosures can be contributed to a significant drop in property values and the wave of exotic mortgage made in 2005-2006. Remember the Map of Misery? It gives you an idea of where the largest numbers of exotic mortgages are concentrated in.

miserymap_thumb.jpg

These red states experienced incredible price appreciation leading up to the peak of the housing bubble. As reflected on the map below, they are now experiencing the brunt of decline.

cfn984.gif

Although we sounded crazy predicting a long and hard housing crisis, it looks like Wall Street is starting to reach the same conclusion that many housing blogs came to last year. According to a Goldman Sachs analyst, “the correction in national house prices is only halfway through” and,

Arizona, Florida, Virginia, Maryland, California and New Jersey, could see further price declines of 25% or more.

Inventory & Market Report – 5/3/08

Zip Codes: 91006, 91007market_icon.jpg

Current Market Listings as of May 3rd, 2008*
Properties for Sale: 218(-13)
Median Listing Price: $779,000 (-0.12%)

Weekly Foreclosure Update*
Properties in Foreclosure: 24 (+0)
Properties in Pre-Foreclosure: 66 (+2)
*+/- is compared to previous week’s data.

For our regular property profile posts, SavedbyGrace has a section labeled “Income Required.” It gives an estimate of how much a household should typically be earning in order to comfortably afford a mortgage. Simply put, the total home price should not be more than four times the home price.

This number establishes a base for affordability after factoring in a 20% down payment, taxes, insurance and other debt. During the last 4 years, buyers put aside these factors and just focused on the affordability of temporary monthly payments. You had no down, interest-only, 1 year teaser rates and other forms of short-term exotic financing. The problem was that these loan programs would eventually reset to the current market rate and the home buyer was no longer able to “afford” their higher payments.

Take a look at the following graph from Mr. Mortgage:

income_chart_th.gif

If you look on Redfin, over half the homes in Arcadia are listed for $700,000+. With the median household income estimated to be $73,992 (2006), there is a wide gap between home prices and actual affordability. You may argue that real estate in Arcadia has always carried a premium, but with a population of over 55,000 people, how many households have $150k+ for a downpayment and earn $200k a year?

Property and foreclosure numbers obtained from U.S. Census, ZipRealty, Trulia, Yahoo Real Estate and Foreclosure.com. Market listings and price data obtained from DataQuick News.

Volume Down. Median Down.

If you refer back to last week’s Inventory post, I had listed the number of home sales for 1st quarter of 2008:

Date Sold Median Price Change YOY
January 32 $687,500 4.17%
February 32 $815,000 -20.61%
March 35 $725,500 -13.16%

That’s a total of 99 homes sold in Arcadia over the last 3 months. How does this compare to previous quarters when the bubble was in full swing? On the chart below, we’re currently on the very right at just under 100 sales.

homes_sales_arcadia.png

Sales skyrocketted during the last half of 2003 and for 4 years Arcadia quarterly sales remained around 200 transactions or more per quarter. That’s averaging about 66 homes a month. We’re currently reporting half those numbers for 2008.

If you look at the Median Price line (in red), it tends to follow the general trend of sales activity. Back in March, our friend over at Dr. Housing Bubble had posted a similar looking chart but it was tracking the median price for LA County.

california-vs-us-median-home-price.jpg

Unless income increases significantly, it looks like Arcadia will continue to follow the general trend of the rest of the county, state and country. And although real estate here will always command a certain premium in terms of pricing, I see 1,000sf, 67 year-old homes listing for $775,000 and my only question is, “WTF?”

This property was bought on January 4th, 2008 for $600,000. I cannot imagine how this home could have commanded a $175,000 premium in just under 4 months.

From the listing:

MUST SEE TO APPRECIATE, MOTIVATED SELLER WILL LISTEN TO ANY REASONABLE OFFER. HURRY HURRY HURRY!!!!!

Hey, look on the bright side. At least it comes with a professionally installed greenhouse.

greenhouse.jpg

So what got us into this mess?

Real estate always goes up.

Land is running out.

Rich foreigners are pouring in by the boat load.

Real estate is a great investment.

So why in the world are we facing the largest housing and credit crisis in U.S. history?

The Culprits

Lenders started pushing sub-prime loans so people with bad credit and no down payment could afford to buy homes. Lenders such as Countrywide even scammed prime borrowers into taking out sub-prime loans. Why? Because back-end commissions were higher and Wall Street eagerly paid for these risky loans.

Artificial demand was created when otherwise unqualified borrowers began buying up houses left and right. There was no significant growth in income or even population. Million dollar homes were bought up by people making less than $100k a year on zero down, interest only, adjustable rate mortgages.

Wall Street somehow decided it was a good idea to securitized these sub-prime loans and sell them on the open market.

Builders decided to increase their home production even though there was no marketing data supporting the need for a significant increase in housing.

The Outcome

GreedGreedGreed. That’s what this housing bubble comes down to.

  • Lender such as Countrywide and New Century are wiped out.
  • Homeowners are losing their homes through rapidly increasing foreclosures.
  • Wall Street giants such as Bear Stearns, Citi and WAMU are in major distress.
  • Public builders such as KB Homes, Lennar and Centex are in a financial mess. Local builders are shutting down left and right.

Feel free to share this post with friends, family and coworkers the next time they ask, “So what got us into this mess?”

Inventory and Market Report – 4/26/08

Zip Codes: 91006, 91007market_icon.jpg

Current Market Listings as of April 26th, 2008*
Properties for Sale: 231(+9)
Median Listing Price: $779,000 (-2.5%)

Weekly Foreclosure Update*
Properties in Foreclosure: 24(+3)
Properties in Pre-Foreclosure: 64 (-2)
*+/- is compared to previous week’s data.

March numbers for Arcadia have been reported. Let’s take a look at how first quarter of 2008 fared.

2008 First Quarter Sales Report

Date Sold Median Price Change YOY
January 32 $687,500 4.17%
February 32 $815,000 -20.61%
March 35 $725,500 -13.16%

Looking at the numbers above, I would say the following Craigslist post holds more truth than humor (formatted for punctuation and spelling):

$300,000 – SAVE 20-30% more on Foreclosures and Lender Owned.

Go ahead and deal with some private party home represented by someone else looking to get into your pockets and asking for top dollar because they think it’s still 2006. Or the homeowner owes way more than the house is worth. Just wait and watch as thousands of homes currently in the foreclosure process pop up everywhere and houses that were selling for $600-800k are selling for $300-400k.

You would have to be rich and don’t care or completely clueless to even consider purchasing a home on a regular listing at this time. WAIT-WAIT-WAIT just 5-6 more months and you will save an additional 20-30% off a market that has alreadt dropped 20-25% in the last 6 months.

-313 mockingbird ln. at eddy & munster

Property and foreclosure numbers obtained from U.S. Census, ZipRealty, Trulia, Yahoo Real Estate and Foreclosure.com. Market listings and price data obtained from DataQuick News.

A Long Way to the Bottom

I recently had the opportunity to meet with 3 individuals who “specialize” in real estate investments. I say this with a sarcastic tone because these guys started flipping properties in 2003 and rode the real estate bubble to success. With all the news lately regarding the drop in real estate prices, increase in foreclosures and other record breaking data, these real estate professionals claimed that we’ll hit rock-bottom this Fall and it’ll be time to jump in again. Since I was the youngest in the meeting, my attempts to explain that we are at least 2 years away from bottoming out were dismissed as ludicrous.

There is no doubt that there will be plenty of knife catchers out there and even many self proclaimed real estate gurus will be victims. What many people don’t realize is that unlike stocks, real estate is not a very liquid asset. It takes several years for values to run up and equally as long to crash.

Let’s take Wall Street’s recent poster child for failure as an example. Countrywide Home Loans’ stock soared alongside our current housing bubble. It went from $13 in 2003 and peaked at $45 in early 2007.

cfc_crash.jpg

As soon at the subprime lending market tanked, it took only 6 months for Countrywide’s stock price to hit $8. It has since bottomed out around $4 before Bank of America decided to bail… sorry, I meant buy them out. Gosh, that sounds awfully familiar.

Unfortunately for us, real estate transactions take 30 days or longer to complete so data is always lagging behind. Because this is the case, historical figures and graphs from providers such as DataQuick and the Case-Shiller Housing Index are valuable resources (below).

caseshiller.jpg

According to this data, Los Angeles home prices peaked around mid-2006 and it has been dropping for over 18 months now (20 if you count February and March). If you look at home prices between 1995 and 1997, you will notice that the market bottomed-out and stayed that way for approximately 2 and a half years.

I keep hearing that us Arcadians now have this psychological barrier when it comes to home prices and the days of desirable $200-400k homes or condos are long gone. If you believe this then be my guest and purchase a home this Summer.

As for me, history says that buying in these market conditions is equivalent to catching a falling knife: the pain will come fast and hard as your neighbor’s REO wipes out any equity left in your home.

This post inspired by my clueless associates and Patrick.net’s Don’t Catch a Falling Knife.