Category Archives: Property Profiles

To buy or not to buy…

That is the question.

That may not be Hamlet’s question, but that is certainly the question looming over potential buyers as they try to decide whether or not to purchase a home right now. I’ve said before that comparable rents is a key indicator of market fundamentals and I still think that holds true today. To truly account for all the pieces of the puzzle, prospective buyers should take all the factors into consideration. That means property taxes, HOA fees, maintenance, insurance, mortgage payments and the whole works.

While that may be the best way to go, it requires multiple calculations and as far as I know, most people don’t bring a laptop with them to open houses. Enter the GRM – gross rent multiplier. It’s a simplified version of the calculations that investors have been using for years. It’s not a precise analysis (as it doesn’t take into account paid utilities, taxes, insurance etc), but it wasn’t meant to be more than just a gut check. Using the GRM would give you a quick overview to determine whether the rental cost will cover the cost of ownership. This is a good tool for investors, but also very useful for potential buyers looking to evaluate RE values.

Overall Annual formula
Market Value/Annual Rental Income = GRM

Monthly formula
Market Value/Monthly Rental Income = GRM

There as been much debate as to what magic number is the “right” GRM. I tend to think there is a GRM range instead of a single value since it’s really just an estimate. Many have used the overall annual GRM of approximate 15 (15 x 12months/yr = 180 monthly GRM) for rent savers and approximately 8 to 10 (9 x 12months/yr = 108 monthly GRM) for cashflow investors.

Let’s apply this quick calculation to some Arcadia properties that are both for sale and for rent.

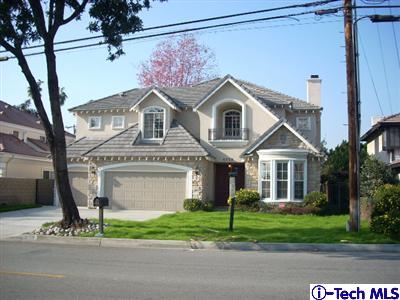
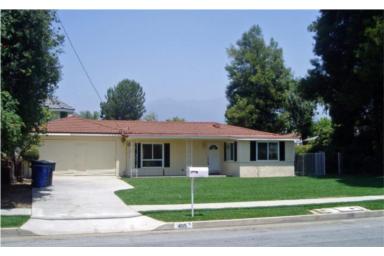
#1) 900 Victoria Dr. 91007
4bed, 2bath, 2034 sqft in Peacock Village
Rent $2900/month (Craigslist)
Asking Price $880,000 (Redfin)
Annual GRM: 25.3
Monthly GRM: 303.5

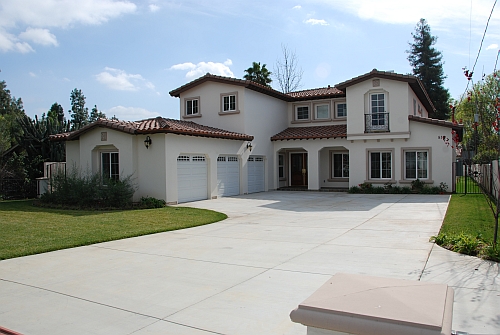
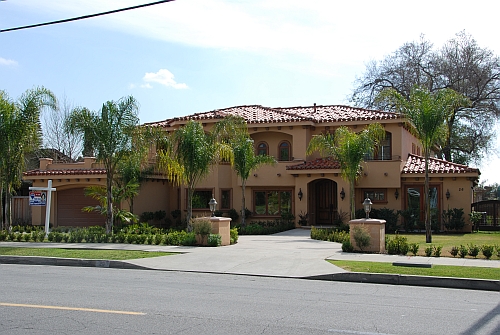
#2) 130 W. Longden Ave. 91007
4bed, 4bath, 2913 sqft in central Arcadia
Rent $3900 (Craigslist)
Asking price $1,328,000 (Redfin)
Annual GRM: 28.4
Monthly GRM: 340.5

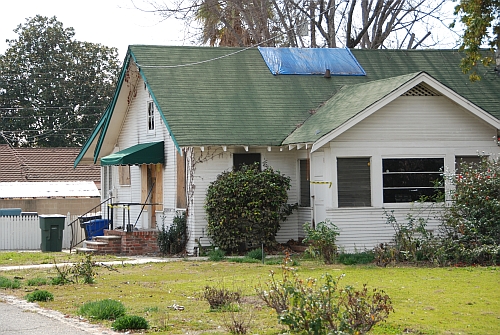
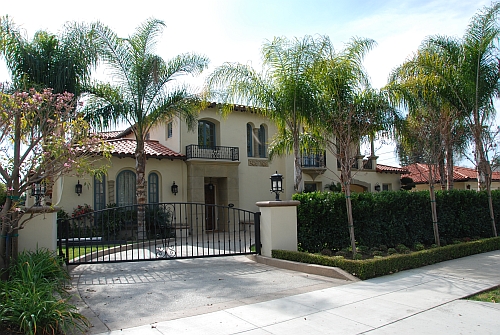
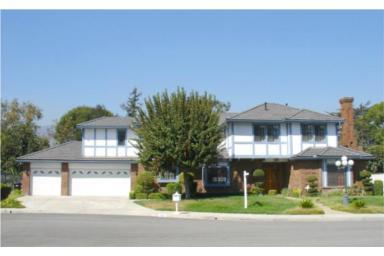
#3) Similar New Construction Townhomes
3bed, 2.5bath, ~1865 sqft off 2nd St.
Rent $2850 (42 Diamond St. Craigslist)
Asking Price $750,000 (50 Genoa St. #B Redfin)
Annual GRM: 21.9
Monthly GRM: 263.1

These are good examples how the gross rent multiplier can be useful. Although not a precise evaluation, these GRM numbers are so far beyond the traditional, acceptable range of 160-200 that there’s no point in even considering a purchase. Surely one can argue that the GRM is just an arbitrary number, but it only takes a few calculations to show that the ownership carrying costs for these properties are more than double that of the rental cost. It makes absolutely no financial sense to buy these homes at these prices when you can rent them for much, much less.

There’s a long way to go before rent savers and investors jump back into the market to create a bottom. The NAR will probably call the bottom five or six times before the actual bottom even begins to form. Sit back, grab a drink and enjoy the show.

Update: Golden McNugget

Today we have clear evidence that Arcadia is not immune from the market forces and that the flip-happy mentality that’s been free flowing for years is coming to a painful end. It’s Valentine’s Day, but there’s no love for this seller. Last month I profiled a McMansion that was a failed flip. Things haven’t gotten much better as the asking price has been reduced twice in the last two weeks.

6709goldenwestave_1.jpg

This specuvestor paid $1.25MM for this in October 2006. After holding it for about a year, they realize there’s no money to be made and put the house back on the market. This is what has happened since November of 2007.

Date Price
02/13/2008 $1,064,000
02/01/2008 $1,169,000
12/30/2007 $1,225,000
11/01/2007 $1,250,000
10/13/2006 $1,250,000
09/07/2005 $1,220,000
08/31/2004 $985,000
10/30/2001 $665,000

As I documented on the original post, these folks bought with 100% financing ($1MM 1st loan and $250k on the 2nd loan). The 2nd mortgage lender will lose almost all their $250,000 (there’s $160 left) after 6% commission and fees. See why there’s no more secondary mortgage market? It’s been completely wiped out.

The primary bag holder will still get their $1MM back if they can sell for this price. The sellers are desperate as they are now offering to “help pay for buyer’s closing costs with an acceptable offer, if escrow is closed on or before March 24, 2008.

love_house_small1.jpg

What is an acceptable offer? It’s been on the market for 105 days with a total of three price reductions. I say the market has already spoken and an “acceptable offer” is much, much lower than $1,064,000.

The current asking price will put them at a total loss of $186,000 or 15% off the 2006 purchase price over just 16 months. I don’t think they love this house anymore.

This property almost doubled in price in just 5 years during the boom. Does anyone else see anything wrong with that? What will things be like in another 16 months from now in summer of 2009? Another 15% off today’s asking price? 20% off? 30%+ off?

Only time will tell and buyers have all the time in the world to decide.

Out and About

Last week’s find – $900,000 Dirt, was so outrageous I decided to check out the property in person. Time permitting, I will attempt to check out properties on a weekly basis and share my findings here. There are some things you just can’t see or tell from a Redfin or ZipRealty listing. Here’s a better picture of the property. The windows are boarded up and it seems as if the property has been vacant and neglected for quite some time.

300_camino_a.jpg

There was a big stack of flyers so either the realtor just refilled the box that morning or there are no interested parties. The description is the same as what’s listed on Redfin, but it lists the following properties on the same street as “**************Comparable Listings***************” (yes, complete with the annoying asterisks).

20 E. Camino Real sold for $2,780,000 (7050sqft /19000sqft)
26 E. Camino Real asking $2,780,000 (5744sqft/21470sqft)
810 E. Camino Real asking $1,980,000 (4007sqft/67 x 233)

I took a look up and down the street and it seemed like a decent neighborhood. Traffic on Camino Real is moderate and even heavy at times for a residential neighborhood. Nonetheless, it’s a nice street so I proceed to hunt for these “comparable listings.” When I saw these other houses, I thought my navi unit gave me faulty directions because they’re so drastically different I wouldn’t even think they’re comparable.

810 E. Camino Real Avenue for $1.98MM
810_camino_a.jpg

20 E. Camino Real Avenue for $2.78MM
20_camino_a.jpg

26 E. Camino Real Avenue also for $2.78MM
26_camino_a.jpg

The point of comparable listings is to show the buyer what they can get for the same amount of money in relatively the same area/neighborhood. Here we have a desperate realtor trying to spin his burnt down house on a dirt lot as a bargain by comparing it to 3 brand new homes on the same street. I don’t know about you, but being on the same street is about all that $900k Dirt shares with these other homes.

I don’t see anything being comparable whatsoever. All this tells me is that someone can buy the land for $900k, build a mcmansion on it and turn around to list it for 3X the price in a crippling housing market. If you are a buyer, wouldn’t you rather buy this or this for a similar price and just remodel it, if needed? If you are an investor, would you put money into the US housing marking knowing it will fail? I don’t see very many (if any) interested buyers willing to invest $900k in hopes of turning dirt into gold dust.

Flipping Woes on Camino

405 E. Camino Real Ave

405caminoreal_1.jpg

Asking Price $548,000 ::: Sq-ft 812
Purchased Price $505,000 ::: Lot Size 5,040
Purchased Date 06/08/2007 ::: Beds 2
Days on Redfin 110 ::: Baths 1
$/Sq-ft $675 ::: Year Built 1947
20% Downpayment $109,600 ::: Area Santa Anita
Income Required $137,000/yr ::: Type SFR
Est. Payment* $2,771/month ::: MLS# A07153216

*Estimated monthly payment assume 20% down, 30-yr fixed @ 6.50%

This seller has an astounding asking price of $675/sq-ft for this teeny, tiny 812 square foot house on a postage stamp sized lot. That’s about the size of two two-car garages, if not smaller. It’s been on the market for 110 days and counting. How many more days and price reductions would it take to move this property?

Past Sales History

  • June 8, 2007 $505,000
  • Sept 19, 2005 $550,000
  • June 16, 2005 $418,181
  • Dec 30, 1996 $163,000
  • July 16, 1996 $114,885

Recent Listing History

  • Oct 20, 2007 $578,000
  • Dec 17, 2007 $568,000
  • Jan 30, 2008 $548,000

This property was purchased in June of 2007 for $505,000. After sitting on the home for 4 months, the owner listed it for $578,000. Notice that nothing was done to the property as the kitchen, restroom and landscape renovations were done in 2005. Maybe the owner thinks his “NEW GARAGE DOOR” is worth the $73,000 premium, but the market didn’t. The original listing price was followed by 2 price reductions totaling $30,000.

There was an open house at this listing last Sunday, but I didn’t go in. I didn’t see any cars in front of the driveway so I presumed there were no potential buyers inside at the time. Perhaps I should have went in and asked the realtor why he thinks this house should command $548k or make some ultra low-ball offers just for kicks. I wonder what he would say.

This house is just a few doors down from the $900,000 Dirt we profiled last week. I went by to check out that property in person and took some better pictures. Look for an update on that property tomorrow.

Flip ‘n Flop

725 Tiffany Terrace

725tiffany_1.jpg

Asking Price $998,000 ::: Sq-ft 2,777
Purchased Price $1,038,000 ::: Lot Size 8,625
Purchased Date 06/05/2007 ::: Beds 4
Days on Redfin 101 ::: Baths 3
$/Sq-ft $359 ::: Year Built 1985
20% Downpayment $199,600 ::: Area Near Monrovia
Income Required $249,500/yr ::: Type SFR
Est. Payment* $5,046/month ::: MLS# A07156761

*Estimated monthly payment assume 20% down, 30-yr fixed @ 6.50%

Here we have another flip gone wrong. It was very tempting for speculators to take part in the bubble when housing prices were ballooning at the alarming rate of yesteryears. This flipper was late to the game and have since lost a chunk of their downpayment and counting. How much will you think they’ll lose when it’s all said and done?

Sales History
Oct 18, 1996 $470,000
June 5, 2007 $1,038,000

  • 1st Mortgage $778,500
  • 2nd Mortgage $150,000
  • Downpayment $109,500

Recent Listing History
Oct 28, 2007 $1,138,000
Nov 14, 2007 $1,080,000
Dec 18, 2007 $998,000

This flipper ignored signs of the struggling market and bought this flip with just over a hundred grand downpayment last summer. Delusional with promises of never ending double-digit growth, they put this house on the market with new flooring after just 4 months with a $100,000 premium. Just 2 weeks after that, news of the troubled market must have finally scared them and the asking price dropped by $58,000 in hopes of breaking even after fees. By December, it’s still on the market so they proceed to reduce it by another $82,000 to push for a sale.

It’s been 6 weeks since the last price reduction and there’s no end in sight. This is now listed as a short sale subject to final lender approval. My crystal ball says there’s another price reduction coming up soon if they really want to move this property. In this case, the specuvestor gets burned because they put down money and the bank will also lose because the property is no longer worth what they paid just a few months ago.

If you made almost a quarter of million dollars a year, would you plunk down $200k on a $1million dollar property off 8th street near Monrovia? If you had to pay over $5,000 per month in mortgage payments (excluding property taxes, insurance, maintenance etc), is this the kind of house you picture yourself living in? Yeah, I didn’t think so either.

Not So Peachy Anymore

***Update*** This listing was modified today to include a slightly lower asking price of $679,000. You think the realtor/seller saw our profile and decided they need to do something to move this property? The direction is correct; the magnitude is not sufficient.

517 Peachtree Lane

517peachtree_1.jpg

Asking Price $699,900 ::: Sq-ft 1,492
Purchased Price $825,000 ::: Lot Size 8,900
Purchased Date 08/29/2006 ::: Beds 3
Days on Redfin 139 ::: Baths 2
$/Sq-ft $469 ::: Year Built 1965
20% Downpayment $139,980 ::: Area Near Monrovia
Income Required $174,975/yr ::: Type SFR
Est. Payment* $3,539/month ::: MLS# 22099204

*Estimated monthly payment assume 20% down, 30-yr fixed @ 6.50%

This is a case of irrational exuberance and greed.
Let’s take a look at the sales history.

Previous Sale
June 02, 1989 $360,000

Purchased on August 19, 2004 $750,000
Down payment – $0
1st Loan – $600,000
2nd Loan – $150,000

Refinance on August 29, 2006 $825,000
Withdrew $75,000 in cash

These folks bought on 100% financing in 2004 for $750k. It was most likely an option loan that reseted 2 years later, at which time they decided to refinance the property again at the re-appraised value of $825k. In the meantime, they pulled out $75,000 from the ATM on the side of the house and probably bought a new luxury car and a big screen tv. Fast forward to 14 months later, it’s October 2007 and they realized the market was going to hell and they could not afford the payments anymore so they put it on the market.

Initial Listing
October 29, 2007 $729,900

Reduced Price
January 11, 2008 $699,900

I didn’t see two separate loans for the refinance so the owner squatter was somehow able to find a lender to take on the entire $825,000. Even in the heydays of nilly willy no-doc, non-existent underwriting bubble mania, I can’t see a bank stupid enough to make a loan for the entire amount. Perhaps greed got the best of everyone involved who was expecting further unjustified growth of the bubble. Since this was purchased on 100%, it would be considered a short sale and subject to bank approval. If the sellers get their asking price, the bank stands to lose $125,100 or 15%. Even with a price reduction, the listing has been on the market for 139 days.

In the meantime, these “owners” came out winners because they cashed out on $75,000 and walked away with nothing more than a dinged credit score. Assuming the lender is still float, how many more of these bad loans do you think they can absorb before they go under?

Things aren’t looking so peachy anymore.

Golden McNugget

6709 N Golden West Ave.

2/14/08 Update on listing price reduction

3/25/08 Sold for $970,000 (22% off peak)
6709goldenwestave_1.jpg

McMansion alert! McMansion alert! McMansion alert!

Here’s another McMansion up for sale. I can’t imagine why anyone would like the look of a house that’s way overbuilt on its lot. The dominating three car garage at the front of the house is so 1980s. According to one of our readers, McMansions are “gaudy” and I agree. The sales history of this property tells yet another story of gambling on a McMansion. Perhaps these folks should have went to the Golden Nugget in Vegas instead of Golden West in Arcadia; they’ll have better odds with their money playing at the tables.

Asking Price $1,225,000 ::: Sq-ft 3477
Purchased Price $1,250,000 ::: Lot Size 6120
Purchased Date 10/13/2006 ::: Beds 5
Days on Redfin 90 ::: Baths 4
$/Sq-ft $352 ::: Year Built 2001
20% Downpayment $245,000 ::: Area Baldwin
Annual Income Required $306,250 ::: Type SFR
Est. Payment* $6,194/month ::: MLS# 12101558

*Estimated monthly payment assume 20% down, 30-yr fixed @ 6.50%

This stretch of Golden West Avenue used to be quiet, but ever since the 99 Ranch Market plaza popped up in the 90s, traffic has increased substantially. This is within walking distance to the aforementioned strip mall in addition to the Pavilions town center next to it. I often see supermarket shopping carts wander down towards the location around this house making the neighborhood look tacky. In addition, it borders the neighboring town of Temple City so it’s not prime Arcadia real estate by any means.

Date Price Appreciation
10/13/2006 $1,250,000 2.2%/yr
09/07/2005 $1,220,000 23.4%/yr
08/31/2004 $985,000 14.9%
10/30/2001 $665,000 311.8%/yr
02/09/2001 $240,000 76.4%/yr
08/29/2000 $186,000

As IR would say over at Irvinehousingblog, this is a “rollback” to 2005 prices. From the looks of it, the buyer in 2001 bought the property for $240k, plowed it down, built this monstrosity they call a house and sold it 8 months later for $665k. From there, the bubble takes off and wild speculation begins with transactions in 2004 for $985k to upwards of over a million dollars by bubble-mania-euphoria-year 2005. The current seller bought 15 months ago for $1.25MM on pure speculation, but won’t get burned even if he doesn’t get the asking price. Why? Because it was bought with 100% financing.

Loan 1: $1,000,000
Loan 2: $250,000
Downpayment: $0

With zero downpayment, the flipper walks away with nothing but a dinged credit score. In this case, the 2nd mortgage lender will lose $25k if they get their asking price. It’s not pretty either way, but the lenders were stupid to do 100% financing and this should teach them not to do that again.

This property has been on the market for 3 months and it’s likely it will remain unsold without a significant price reduction. If I were to spend around $1.2MM, there are much better choices in more desirable parts of Arcadia such as this in Peacock Village, this and this up in the Highlands.